Drawing Shapes
Introduction
This chapter learns to use OpenCV for drawing operations on images, a feature that will be frequently used later, such as annotating a specific area on an image or drawing a rectangular box around a face.
Experiment Objective
Use the OpenCV library to draw various shapes.
Experiment Explanation
The OpenCV Python library provides various drawing functions that we can use directly.
Drawing Lines
Use the line() function to draw lines. Usage is as follows:
img = cv2.line(img, pt1, pt2, color, thinkness)
Draw a line:
img: Image.pt1: Starting point coordinates.pt2: Ending point coordinates.color: Color (BGR order).thinkness: Line width (thickness).
Drawing Rectangles
Use the rectangle() function to draw rectangles. Usage is as follows:
img = cv2.rectangle(img, pt1, pt2, color, thinkness)
Draw a rectangle:
img: Image.pt1: Top-left corner coordinates.pt2: Bottom-right corner coordinates.color: Color (BGR order).thinkness: Line width (thickness). When the value is-1, it means fill.
Drawing Circles
Use the circle() function to draw circles. Usage is as follows:
img = cv2.circle(img, center, radius, color, thinkness)
Draw a circle:
img: Image.center: Center coordinates.radius: Radius.color: Color (BGR order).thinkness: Line width (thickness). When the value is-1, it means fill.
Arbitrary Polygons
Use the polylines() function to draw arbitrary irregular polygons. You only need to know the coordinates of each point. Usage is as follows:
img = cv2.polylines(img, pts, isClosed, color, thinkness)
Draw an arbitrary polygon:
img: Image.pts: Coordinates of each vertex. Numpy array.isClosed: Whether to close.True: Indicates a closed polygon.False: Indicates an open polygon.
color: Color (BGR order).thinkness: Line width (thickness).
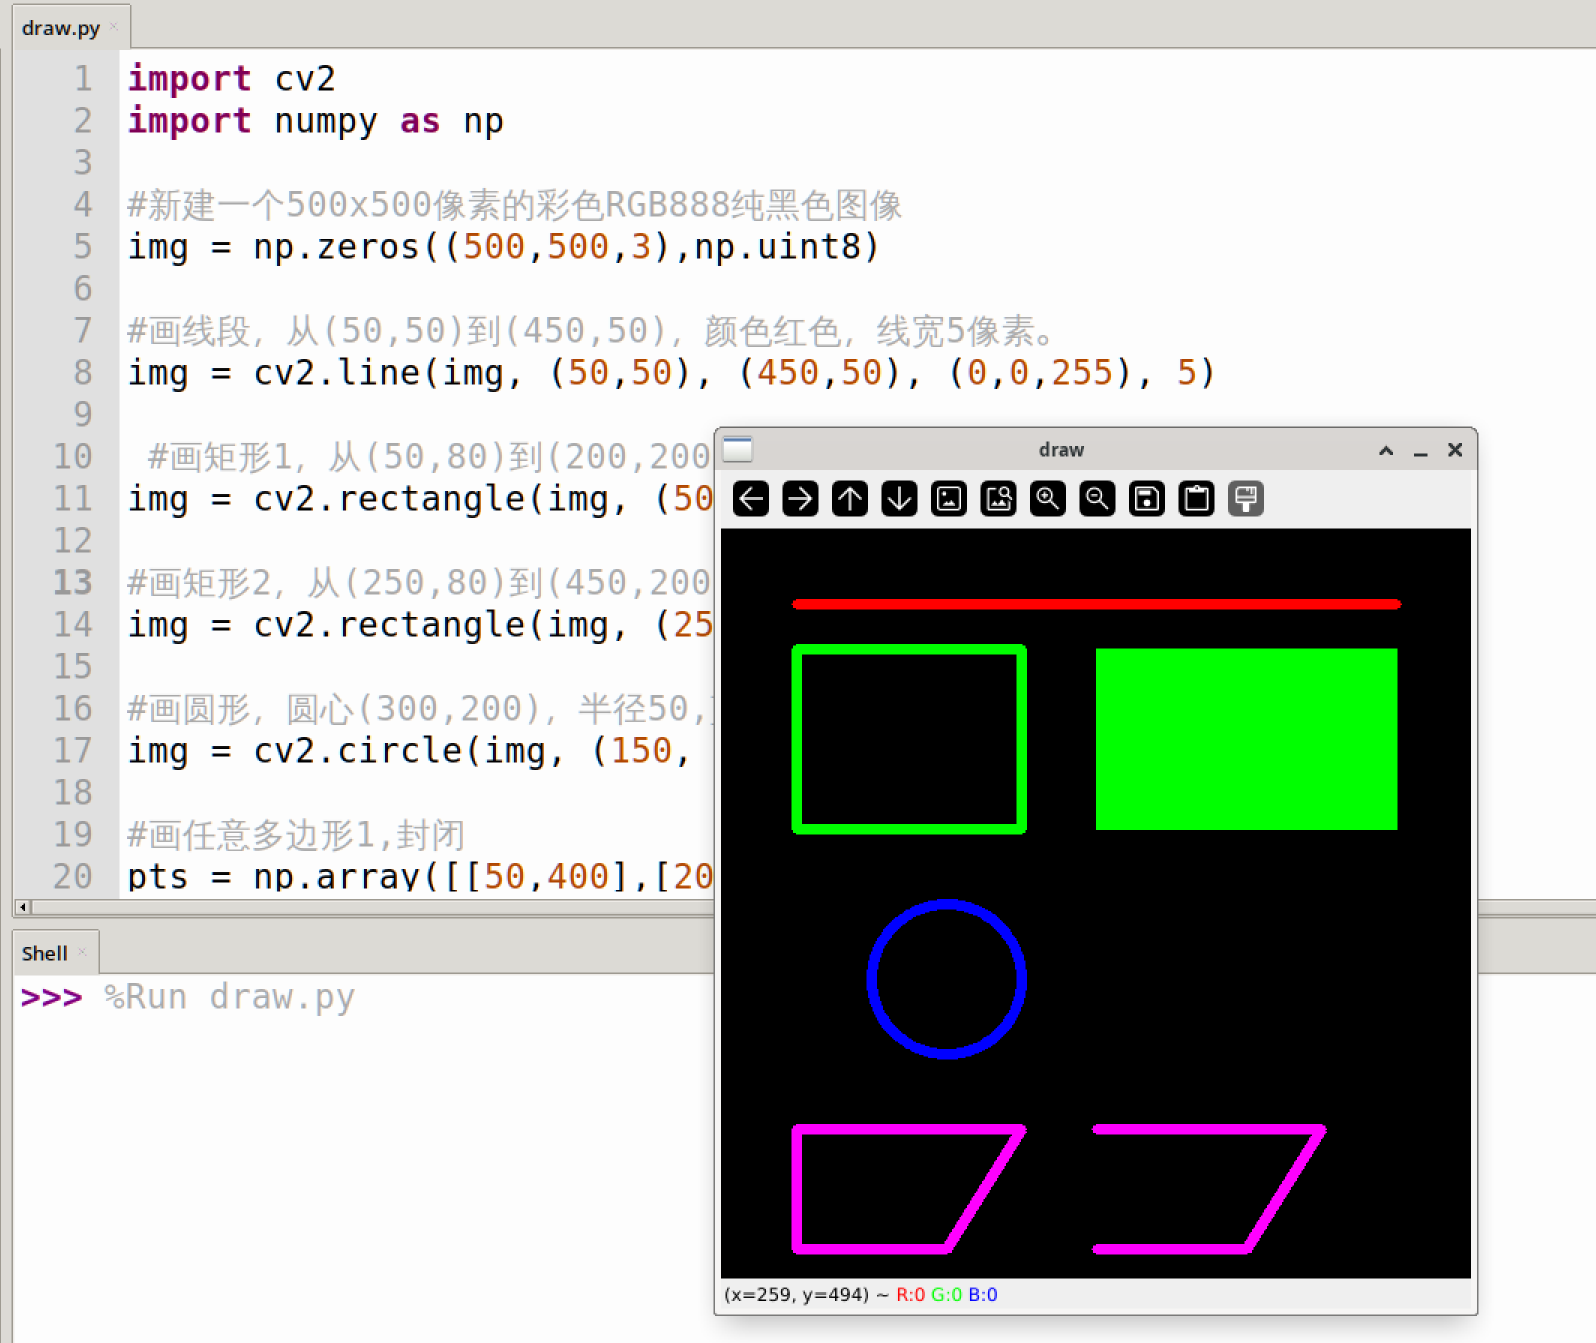
After becoming familiar with the common drawing methods, we will implement the code to create a new canvas (image), draw the various shapes on it, and display them. The code writing flow is as follows:
Reference code is as follows. The code uses numpy's array creation functionality. Numpy is used sparingly in this chapter, so it will not be expanded upon here; you can search and learn about it online.
'''
Experiment Name: Drawing Shapes
Experiment Platform: WalnutPi
'''

import cv2
import numpy as np

# Create a new 500x500 pixel color RGB888 pure black image
img = np.zeros((500,500,3),np.uint8)

# Draw a line from (50,50) to (450,50), color red, line width 5 pixels
img = cv2.line(img, (50,50), (450,50), (0,0,255), 5)

# Draw rectangle 1 from (50,80) to (200,200), green, line width 5 pixels
img = cv2.rectangle(img, (50,80), (200,200), (0,255,0), 5)

# Draw rectangle 2 from (250,80) to (450,200), green, filled
img = cv2.rectangle(img, (250,80), (450,200), (0,255,0), -1)

# Draw a circle, center (150,300), radius 50, blue, line width 3
img = cv2.circle(img, (150, 300), 50, (255,0,0), 5)

# Draw arbitrary polygon 1, closed
pts = np.array([[50,400],[200,400],[150,480],[50,480]],np.int32)
img = cv2.polylines(img, [pts], True, (255,0,255), 5)

# Draw arbitrary polygon 2, open
pts = np.array([[250,400],[400,400],[350,480],[250,480]],np.int32)
img = cv2.polylines(img, [pts], False, (255,0,255), 5)

cv2.imshow('draw', img) # Display the image

cv2.waitKey() # Wait for any key press
cv2.destroyAllWindows() # Close the window
Experiment Results
Run the code on the WalnutPi, and you can see the experimental results as shown below: